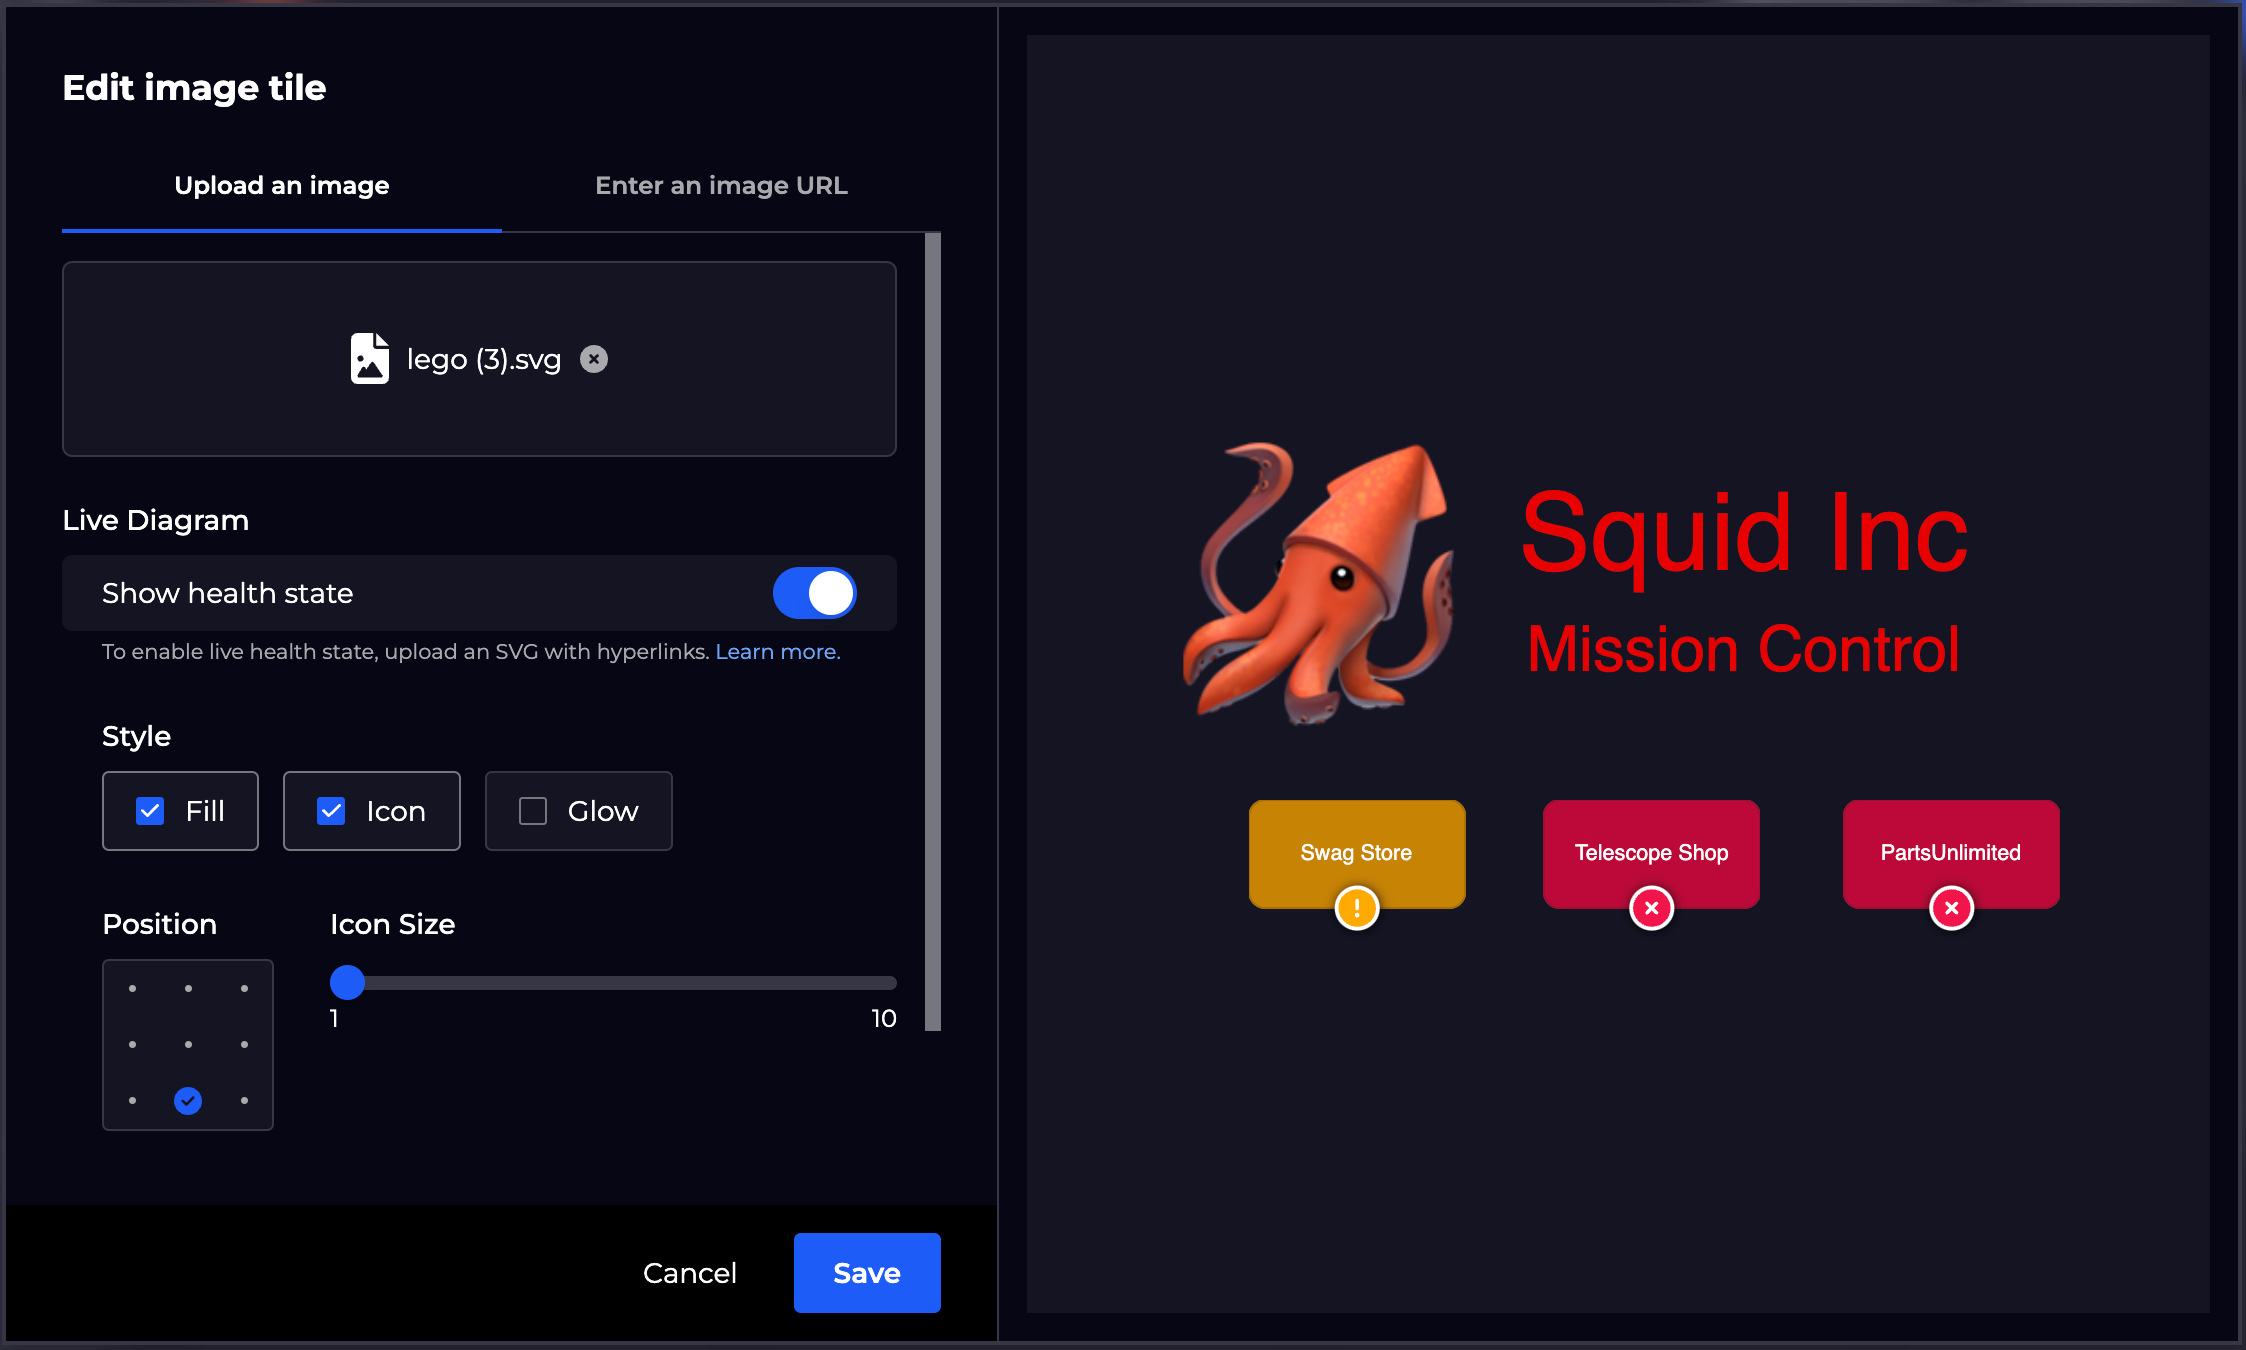
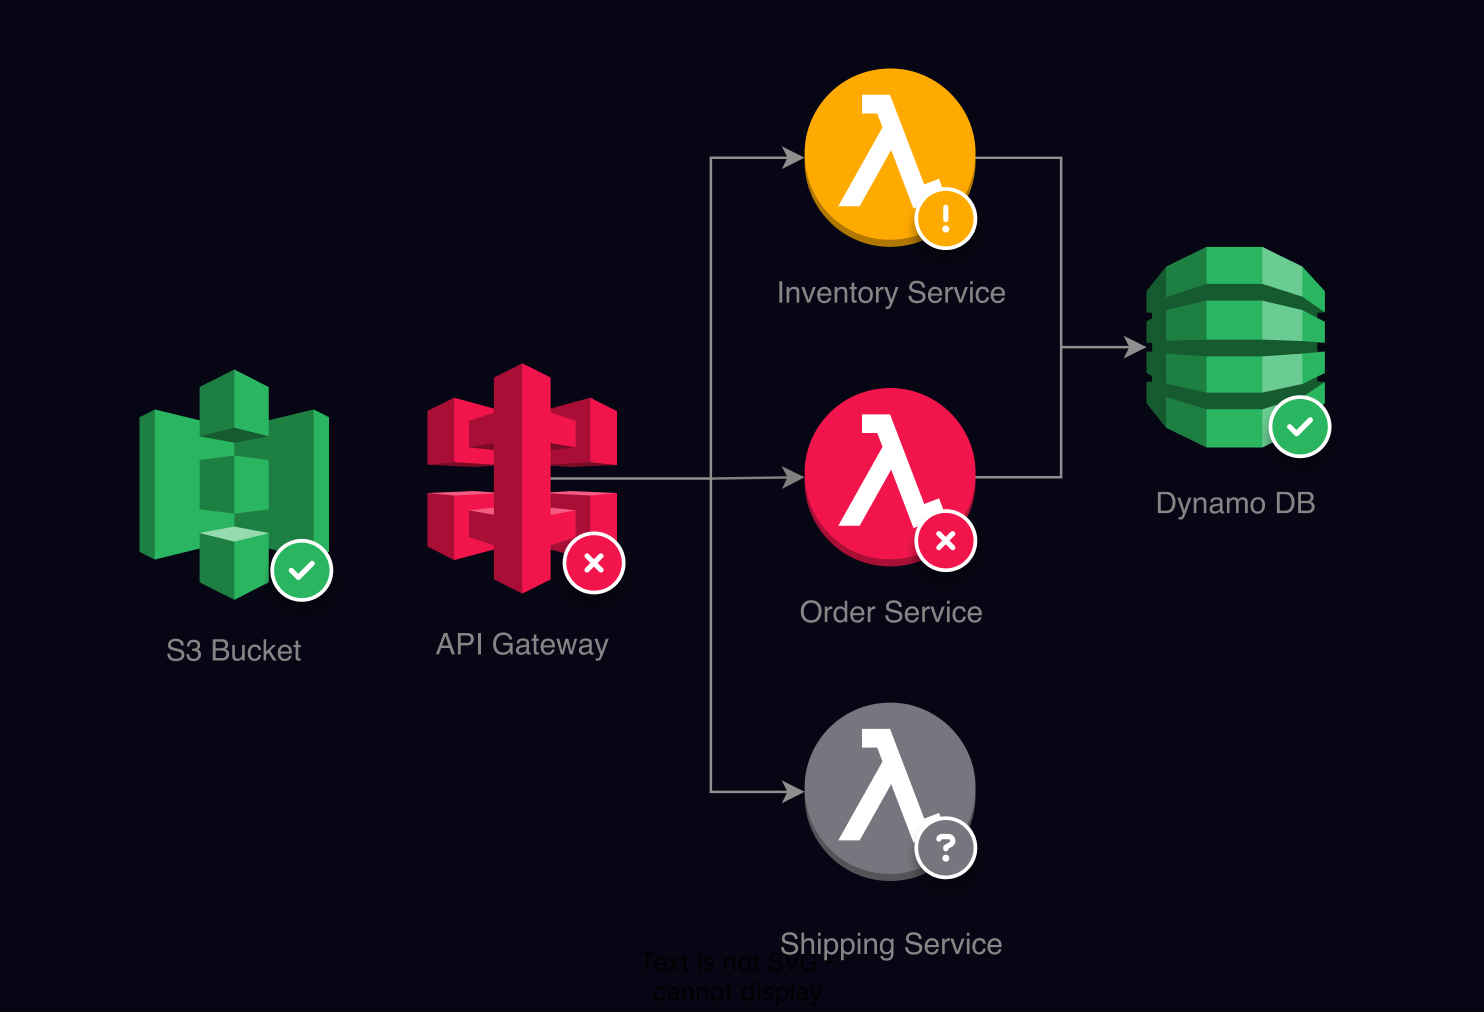
We're pleased to announce the general availability of our live diagramming feature. You can now create live diagrams using the health state of your workspaces and dashboards using the power of SVG.
- Overlay live health state on key infrastructure and application diagrams
- Build customised high-level reporting dashboards
- Integrate health state into maps and floorplan layouts