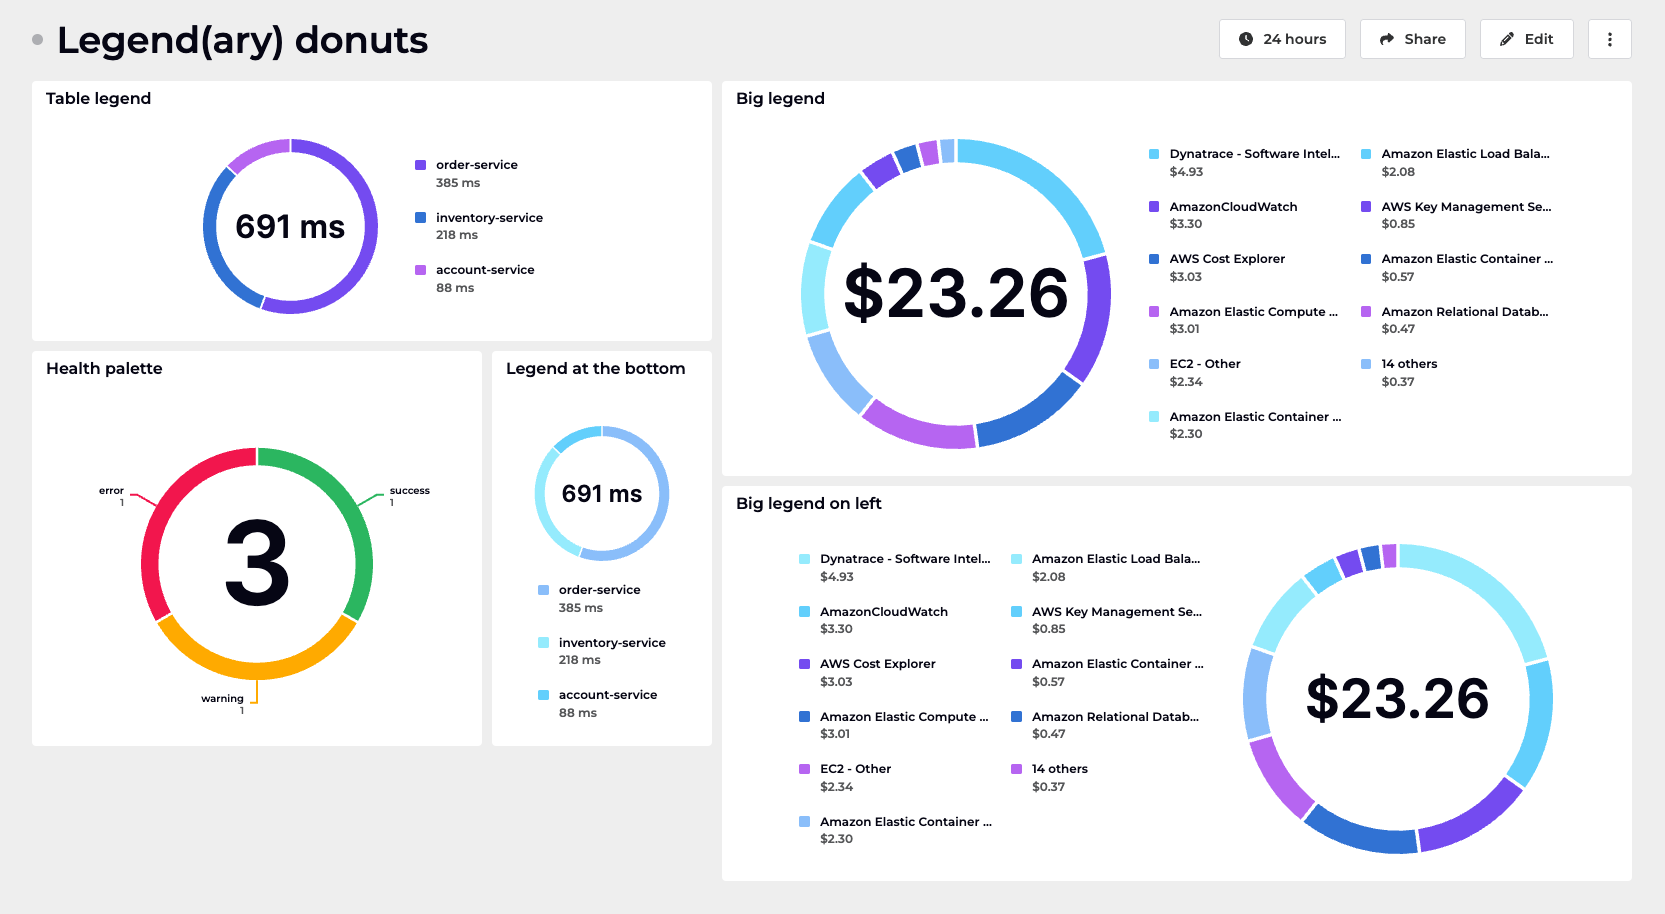
It's now possible to add a legend to your Donut charts, and choose between inline or table positioning. We've also made some other key improvements:
- Updated the styling of the donut to better match other visualizations.
- Introduced a red/amber/green palette that's automatically displayed for health-based data, e.g. count of alerts or server health.
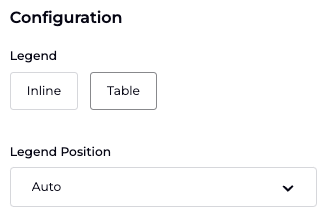
To use this new legend simply select 'Table' under the Legend option when configuring the Donut visualization: