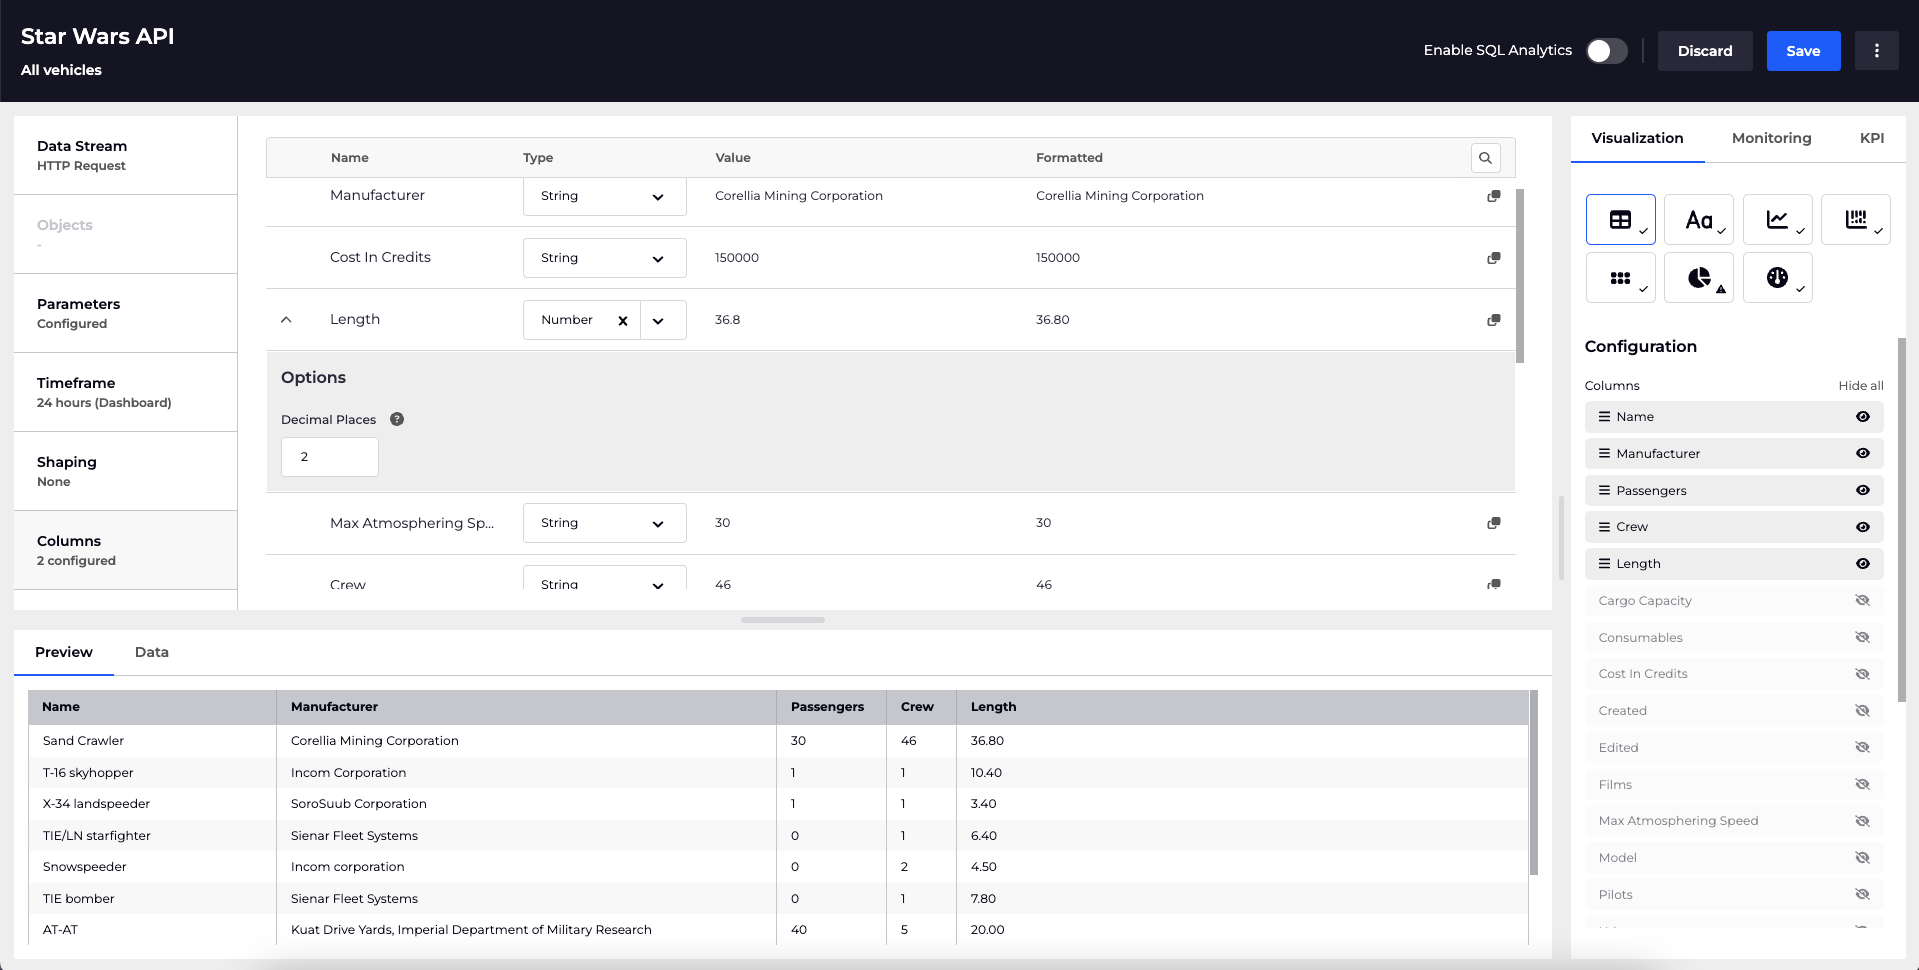
We've just launched a new tab in the tile editor to allow you to customize the columns and their data types directly in the UI. This makes it much easier to work with custom data sources like Web API and PowerShell, wiring them up to any visualization within a few clicks. It's now possible to:
- Set data types for columns we couldn't automatically detect
- Set types like bytes,secondsand currencies
- Customize types, e.g. the number of decimal places, or a custom date format
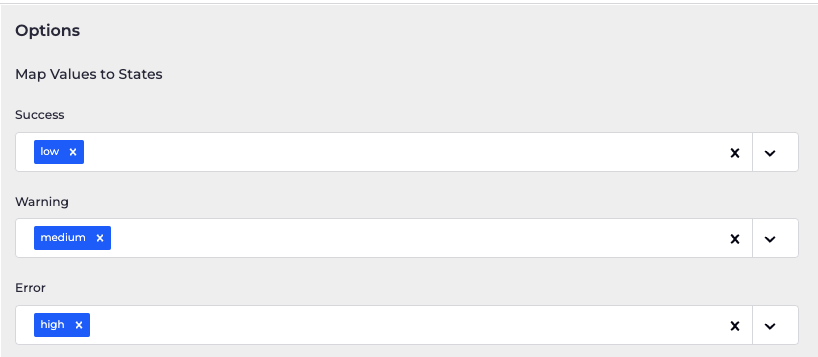
- Map values to health states, e.g. success or warning
To get started, edit any tile and select the Columns tab on the left hand side.